

This is the third and final blog in this series on how public systems actually work in practice. If you haven't already, you may want to start with Part 1: The Most Powerful Entity on Earth is Not a Tech Company and Part 2: You Can't Fight Human Nature. So Stop Trying, which lay the foundation for the ideas explored here.
Here is a thing that happens in almost every large government program, but people don’t talk about it enough. The officials on the ground tell a story based on what they see and experience. The story moves upward through meetings and WhatsApp groups. By the time it reaches the conference hall where decisions are made, everyone believes it. And sometimes the story is wrong. Not because someone lied, but because human beings are wired to identify patterns from what they personally experience.
A ground official approaches ten applicants who say they’re not interested. The official concludes: No one is applying, so applications are falling. They tell their manager. The manager tells the next level up. And suddenly the program is adjusting its strategy based on a feeling that was never verified against the actual numbers. A similar situation happened to us in Mission YUVA. Here we used data to solve for the actual problem on the ground and not the phantom problem being discussed in meeting rooms.
The feedback coming from field level officials was confident and consistent across districts: applications were falling - FAST. Applicants weren’t interested and no amount of convincing was leading to new applications. The initial excitement had peaked, demand had saturated, and on-ground officials were starting to feel like they were fighting a losing battle. Officials who had been driving the scheme energetically started losing momentum. To set some context, we had been pushing officials to cover every panchayat and ward in J&K. This is when we looked at the data and realized that there is a discrepancy in what officials were saying and what we were seeing.
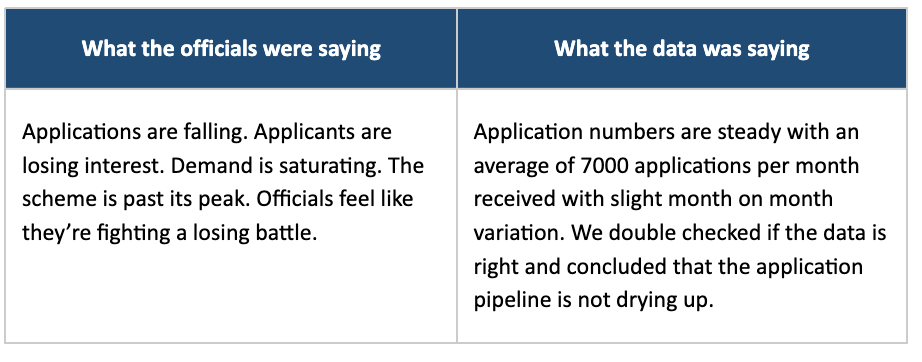
Two completely different stories. Same program. Same time period. One from the people closest to the ground. One from the numbers. The instinct when this happens is to trust the people and recheck the data. So we did. We went back to the raw application numbers from the portal, district by district. The pipeline was intact. The data was right. And it was pointing to something very specific.
Key Learning 1: Ground feedback is mandatory. It tells you how and what people feel. But so is using data wisely and asking the right questions.
If applications weren’t falling, why were officials saying they were? Applications were steadily coming in, but a significant portion were not being sanctioned by the bank. The pipeline wasn’t drying up at the top, it was getting blocked in the middle. Applicants were applying and banks were saying no. Frustrated applicants were telling officials they wouldn’t bother applying again. Officials were hearing only the rejection end of the story. We did an analysis to find out why banks were rejecting applications. This is what we found.
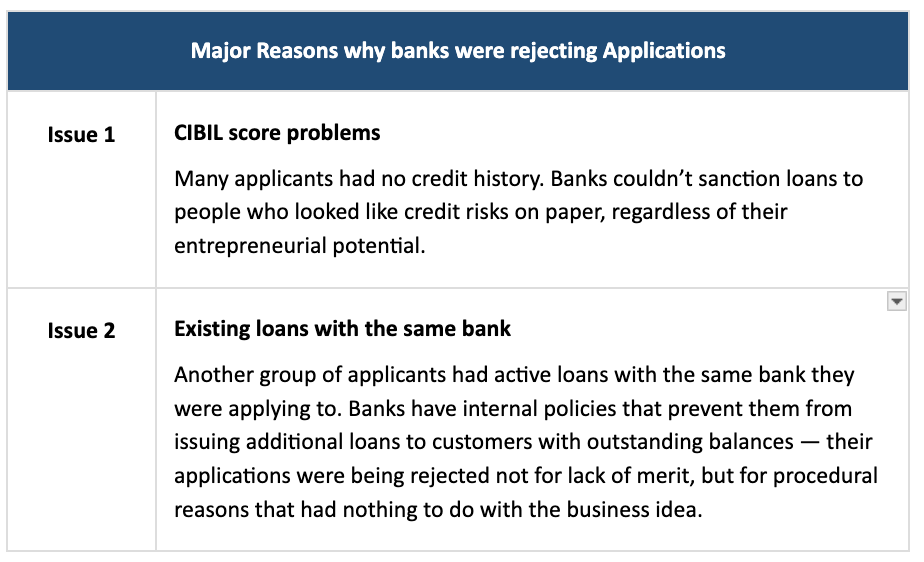
This was clearly a pipeline problem. Applicants wanted credit but banks had their reasons for rejecting them. The officials in the middle were absorbing the frustration without knowing what was happening or what to fix. Once we understood the real problem, we could address it by creating CIBIL resolution pathways, helping applicants identify alternate banks, and giving officials tools to diagnose why a specific application was likely to be rejected before it even reached the bank. The solution was entirely different from what the “falling applications” narrative would have produced.
If we had responded to the story that demand was falling, we would’ve run more awareness campaigns and sent more applicants into a pipeline that was already rejecting them. Data didn’t just show us the whole picture. It saved us from solving the wrong problem.
Key Learning 2: Never design a solution for a problem without understanding its root cause.
Understanding the real problem was only the start of the battle. The officials on the ground were demoralised. And a demoralised government official is a tricky problem to solve. Because unlike the private sector, you can’t easily replace them, retrain them overnight, or restructure the team. You have to work with the people you have.
The tried and tested government solution to this is what I call the ‘dhanda technique’ — the stick. Poor performance? Threat of transfer. Still poor performance? Threat of suspension. It’s blunt, demoralising and creates resentment. It also produces the minimum level of effort required to avoid punishment and nothing more than that.
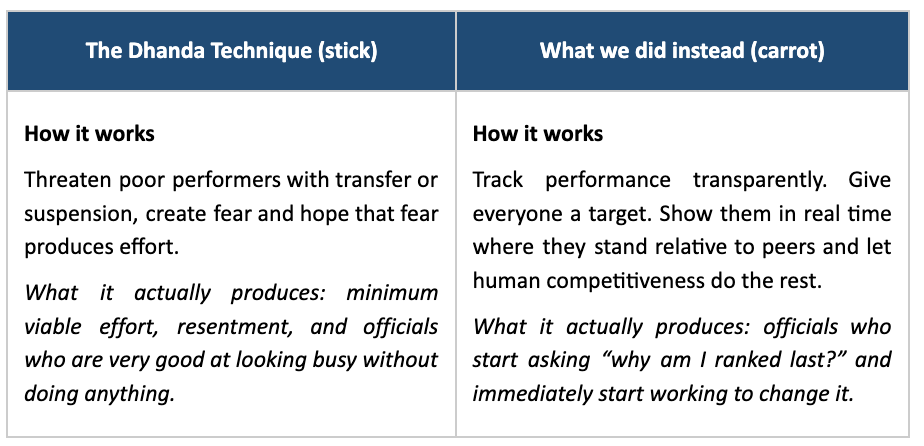
We built a transparent performance tracking system for every district. We set targets. We tracked progress in real time and made it visible to everyone. Then we built district scorecards and not hidden dashboards for top decision-makers, but visible rankings that every official could see.
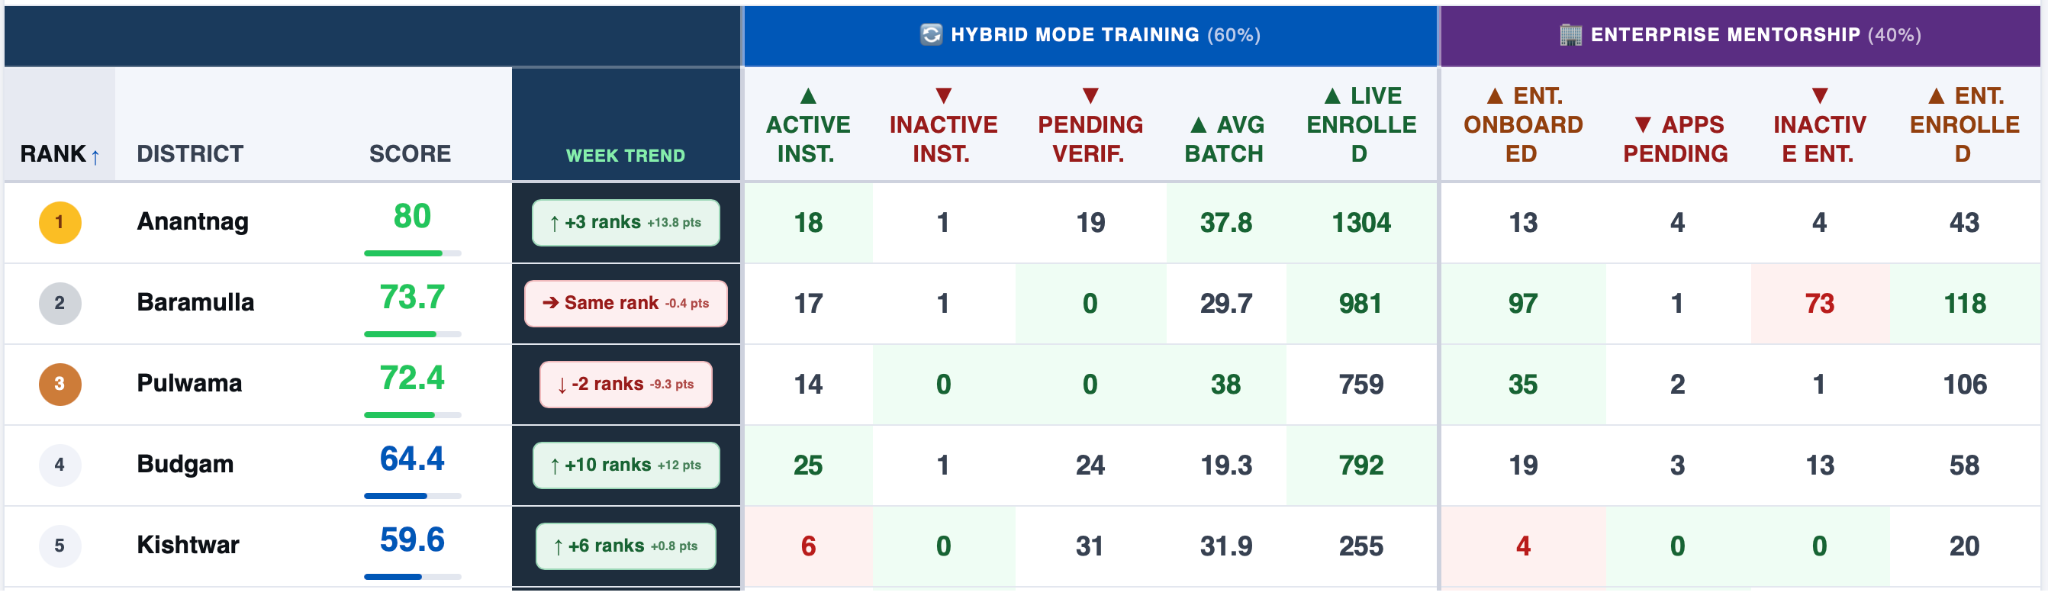
And then things gradually changed. Officials started calling in, not because they were asked to, but to ask questions. “Why is my district ranked lower? What is the top district doing differently?” They started understanding on their own, without anyone explaining it to them, the actions that drive outcomes. The leaderboard just made those connections tangible and visible.
Previously we used to explain to officials how to improve their performance, but the message never really landed. It got diluted through layers of hierarchy or simply ignored because there was no personal stake. But now their district’s name was on a board and it was ranked. Everyone could see it. And nobody wants to be at the bottom.
Key Learning 3: Visibility is a more powerful motivator than threat.
Looking back across all three parts of this blog, there is one common thread. We ran a simple, relentless loop on every single part of the program.

That’s it. We had the honesty and discipline to look at what is actually happening, not what we hoped was happening and respond to what the data showed.
The ground feedback said applications were falling.
The loop said: Check.
The data said: Steady.
The loop said: Then why does it feel like applications are falling?
The data said: Sanctioning is the problem.
The loop said: Fix the bank sanctioning.
But officials got demoralised.
The loop said: Measure their performance, make it visible, let them navigate toward the outcome.
Performance improved. Applications increased.
Every step of that chain was driven by data and not gut feelings or bias. We used data that didn’t have an agenda or ego.
Key Learning 4: Define. Measure. Correct. Repeat.
When I started working in the impact sector, I thought the burning desire to help government work better and passion was enough. Then I realized that passion without systems produces more chaos. I learned that systems without data produce organised blindness. And then I learned what actually works.
It is a combination: the ability to show up day after day, building systems that scale, creating incentives that align behaviour with goals, and using data to improve performance. None of these alone is sufficient. Together, they are what actually moves the needle.
If you take nothing else from this blog, take these: